Skip to content

For solar and battery professionals

From the customer's bill to every solar and battery size modelled hour by hour, a priced proposal and a deck with your logo. About 10 minutes to a credible estimate.

Free for one project. New companies get a 30-day Pro trial at signup.

Bill Data: the customer's bill is read line by line, with anything unsure flagged to check before you confirm it.

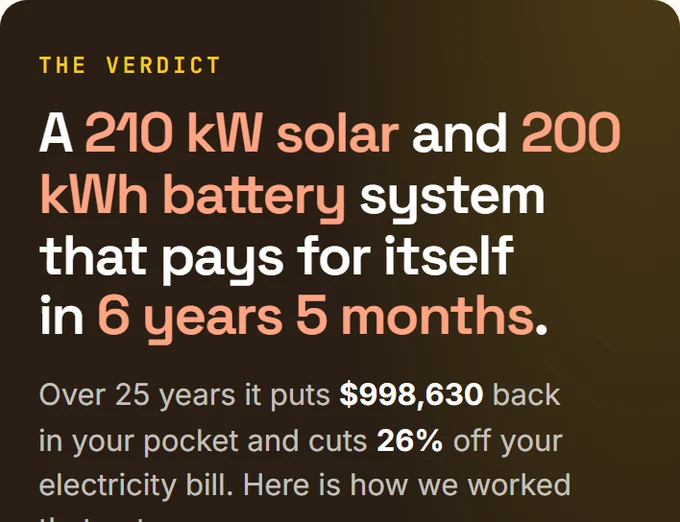
The Recommendation screen showing the picked system, 220 kWp and 200 kWh.

Example project: Industrial site, Central Coast NSW, 220 kWp + 200 kWh. Every figure in the demo and the matrix is from that one modelled run.

Features

Everything In One Model

Sizing Matrix

Every solar and battery combination, modelled hour by hour over a year. Hover a square to see the numbers behind it.

94viable
of 297
1,000
750
500
499.2
400
300
200
100
None
One square
one modelled combination
Shade
NPV, $16k to $364k
Hatched
filtered out
Best NPV
$363,644, 310 kWp + 200 kWh
The pick
220 kWp + 200 kWh

Energy Schedule

200 kWh · 88 kW

Grid peak 111 to 55 kW in the demand window · +$11,493 a year over solar alone · battery payback 8.8 years

055 kW110 kW165 kW220 kWDemand window, 8am to 8pm111 kW solar only55 kW with battery0h4h8h12h16h20h24h
  • Load
  • Solar used on site / exported
  • Battery discharging / charging
  • Grid import

The hourly dispatch for one modelled day at the recommended size. Hover or tap any hour for its readings.

The Bill, Read For You

Tariff, usage, demand and daily charges, read from the PDF. Unsure fields are flagged.

  • Retail tariffTime of use
  • Peak usage, this bill46,782 kWh
  • Demand charges, this bill$5,870.94
  • Days on this bill28
  • Total this bill$15,771.41
  • Export tariffcheck

Every Incentive, Itemised

Each scheme on its own line of the quote, with the rule that decides it.

  • STCSolar up to 1 MW
  • LGCSolar above 1 MW
  • Battery STC5 to 100 kWh
  • VEECVictorian sites
  • PDRSNSW peak demand

Certificate prices and dates: Five Schemes, Priced.

A Deck And An A4 Proposal

A PowerPoint deck from the Analysis and an editable A4 PowerPoint proposal from the Proposal. Your logo on both.

PowerPoint deck, 16:9, from the Analysis3 / 16
A4 PowerPoint proposal, one editable page per slide, from the Proposal2 / 11

The A4 PowerPoint and the customer link come from the Proposal, which models the site's own roof face (15° north) and so expects about 2% more solar than the Analysis, with a slightly shorter payback.

Why the numbers hold

Five Things The Other Quote Gets Wrong

Your customer is buying a payback, not panels. Amperage handles each of these in the same model.

  1. 01

    Demand Charges Left Out

    Solar barely touches them. Leave them out and the saving looks better than it is.

    How the bill is read
  2. 02

    A Flat Tariff

    Time-of-use windows decide what each kilowatt-hour is worth. Flatten them and the payback moves.

    Where tariffs come from
  3. 03

    Sized To The Roof

    If the site runs light at midday, the extra kilowatts are exported, not saved.

    See the matrix
  4. 04

    No Battery Case

    It should be a comparison, not an upsell or an omission. Sometimes it clearly does not pay.

    See the battery
  5. 05

    Incentives Blurred In

    Before or after certificates? What site works? Both should be itemised.

    See the quote

Every Figure Has A Source

Weather
A typical weather year from the nearest BoM climate file, hourlyProduction per roof face, from tilt and direction
Network
AER-approved tariff schedules, reviewed before useDemand and capacity charges modelled, not averaged
Retail
Consumer Data Right plan dataTime-of-use windows only. Retail rates never shown
Incentives
Scheme rules and approved certificate pricesEach scheme shows its rule and the price used
Customer
Their bill and interval dataConsumption never comes from weather

No customer logos yet.

Five Schemes, Priced

STC
Solar up to 1 MW, from 1 Oct 2026
$39.80 · 9 Nov 2026
Battery STC
Cheaper Home Batteries, 5 to 100 kWh
$39.80 · 9 Nov 2026
LGC
Solar over 1 MW, yearly
$7.50 · 9 Nov 2026
VEEC
Victorian sites
$79.50 · 9 Nov 2026
PDRS
NSW peak demand reduction
$2.70 · 9 Nov 2026

Pricing

One Plan, Per Company

Start free with one project. Move to Pro when the team quotes with it.

Free

$0for one project

No card needed.

  • One project
  • The sizing matrix
  • Every incentive scheme, in the app

Pro

$799a month, per company

Or $7,990 a year, two months free.

  • Five seats per company
  • Unlimited projects
  • Analysis and Proposal
  • Deck and A4 PowerPoint proposal
  • Customer web links, with open alerts
  • Your branding on every output
  • AI bill reading and AI features
  • Library, templates, brand profiles
Start your Pro trial New companies get a 30-day trial at signup.
Prices in AUD. No GST is charged. Billed per company, not per seat.More than five seats? Talk to us.

Questions

Straight Answers

Something else? hello@amperage.app

How long does a job take?

About 10 minutes from the customer's bill to a credible estimate in Analysis. A full Proposal takes longer, depending on how much roof, tariff and pricing detail you add.

Is the modelling hourly?

Yes. Solar production and battery dispatch are simulated for every hour of a typical weather year from the nearest BoM climate file, against the site's own load and its network tariff, including demand charges.

Which incentive schemes are included?

STCs (including battery STCs under Cheaper Home Batteries), LGCs, VEECs and the NSW PDRS. Each one shows the rule it applied and the certificate price it used.

Can I put my own branding on the outputs?

Yes, on Pro. Your logo, colours and contact details go on the PowerPoint deck, the A4 PowerPoint proposal and the customer web link, from a brand profile in Settings.

What happens to my customer's data?

Bills and interval data are stored against the project, inside your company's account, and are visible to your team and to the people you share the project with. Bill PDFs are read by Anthropic's Claude API, which does not use API inputs for model training.

Does it replace my panel layout tool?

No. Amperage models roof faces (their tilt, direction and capacity), not individual panel placement. Keep your layout tool for the panel plan.

Model Your Next Job Before You Quote It.

Bring a real site to the free plan and see what the payback looks like.